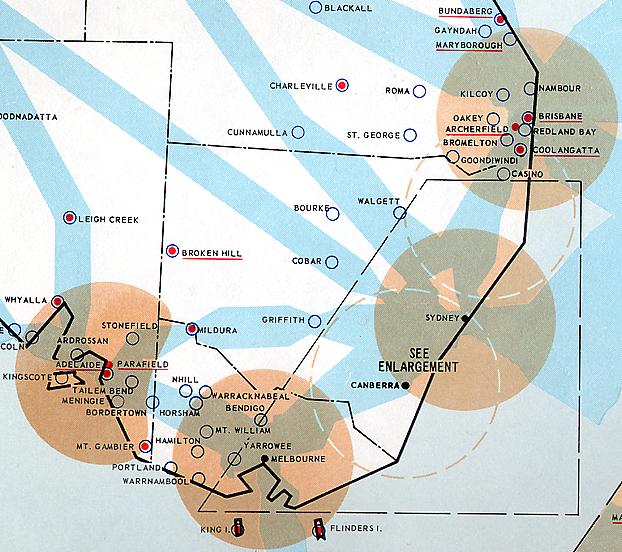
This
chart, from the 1966-67 DCA Civil Aviation Report, shows the extent of controlled
airspace and radar coverage at that time. The area shown in this enlargement shows
what has become known as the 'J-curve' - that bit of eastern and south-eastern
Australia stretching from north of Brisbane around to west of Adelaide which marks,
even today, the extent of continous radar coverage at altitude.
The darker blue 'corridors' show the extent of en route controlled airspace and closely follow the major trunk routes. As IFR navigation was entirely dependent on radio navigation aids (VAR, VOR and NDB) for track guidance, the air routes go from navaid to navaid (shown as small circles on this chart). The 'narrowing' of the controlled airspace corridors near navaids is a function of the navigation tolerances of aircraft flying the routes.
Locations carrying a red dot had an Air Traffic Control or Communications (Flight Service) units. Red underlined locations had a DCA Fire Service unit (locations within the dashed box marked 'SEE ENLARGEMENT' are not shown).
The orange circles indicate the extent of radar coverage, at this time primary radar only, at approximately 40,000 feet. The coverage of the Adelaide radar, located at West Beach airport, is truncated to the east due to the Adelaide hills. The orange dashed circles indicate the computed coverage from proposed additional sensors - but it would be many years before radar coverage at altitude throughout the 'J-curve' would be complete. Click here to see a photo and read more about the radar sensors.
Return to the larger view of this chart
Return to the main Air Traffic
Services index
Return to the main Communications & Navigation index
If
this page appears without a menu bar at top and left, click
here